Charts prepared by K. Rupa Kumar & J.V. Revadekar
© Monsoon On Line
Last Updated : October 02, 2008.
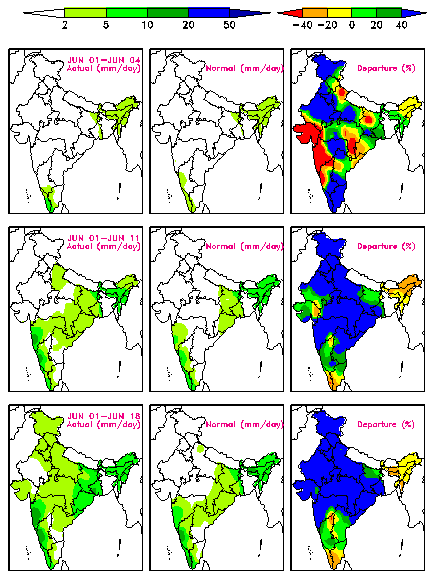
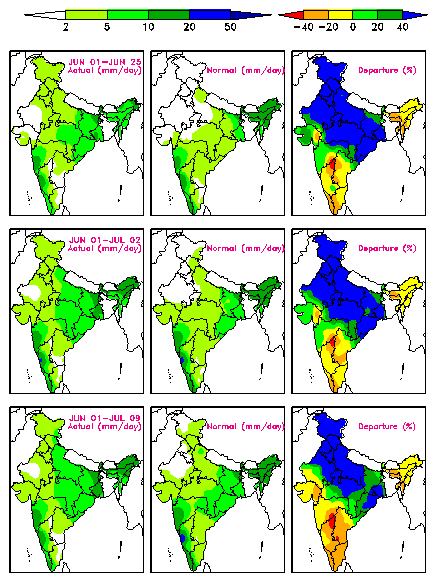
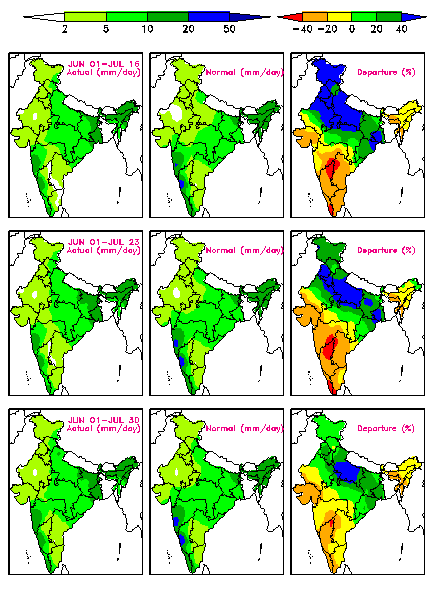
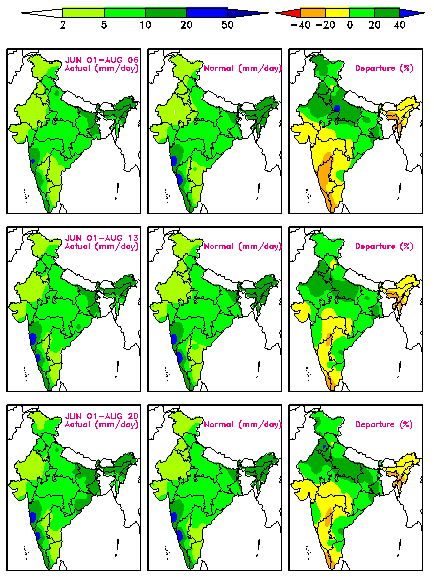
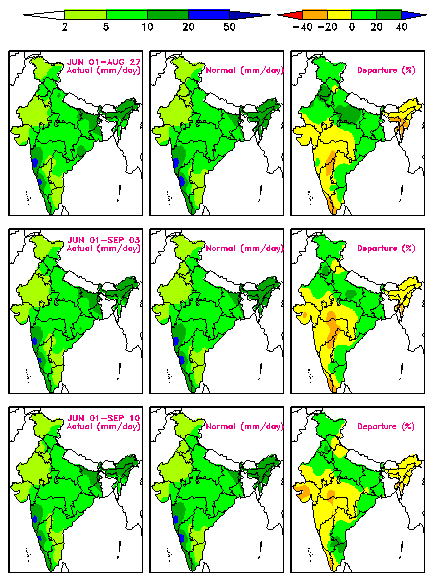
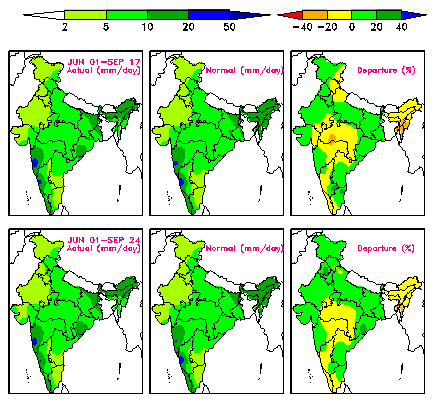
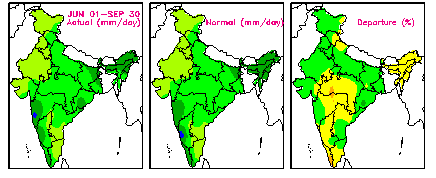
These charts are based on the cumulative rainfall data for 36 meteorological subdivisions of India, computed from real-time reports and published in the Weekly Weather Reports issued by the India Meteorological Department. Each row of the panels corresponds to the period indicated. In each row, the three panesl indicate, from left to right, the mean daily rainfall, corresponding long-term normal and percentage departures.
Charts prepared by K. Rupa Kumar & J.V. Revadekar
© Monsoon On Line
Last Updated : October 02, 2008.