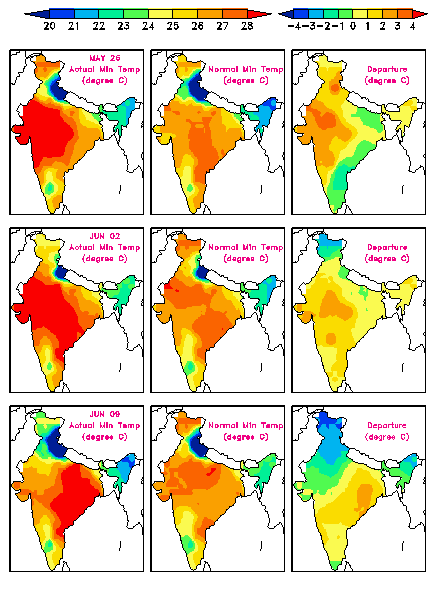
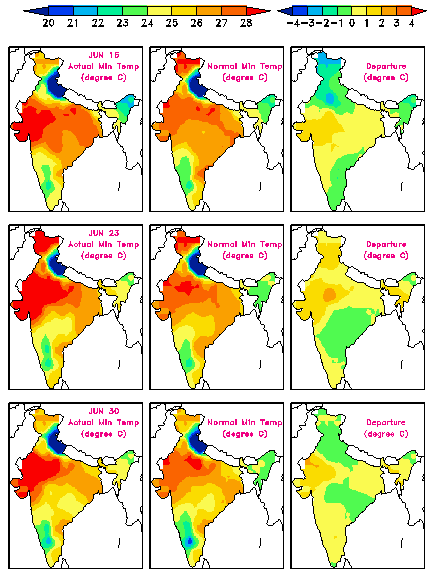
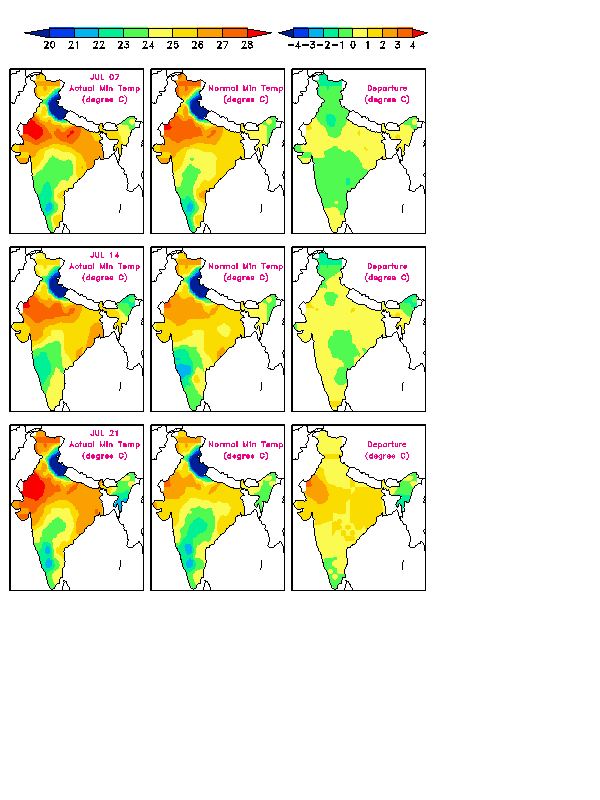
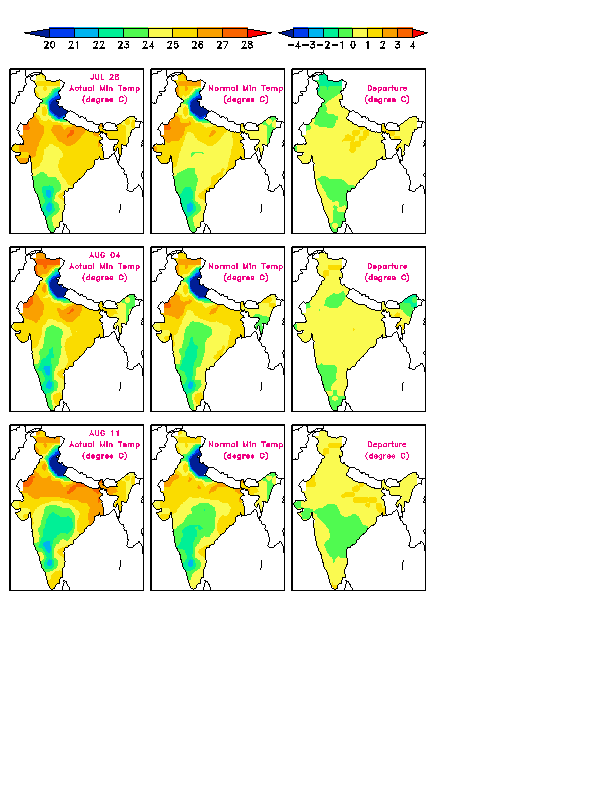
Spatial Patterns of Weekly Minimum Temperature Anomalies (degree C)
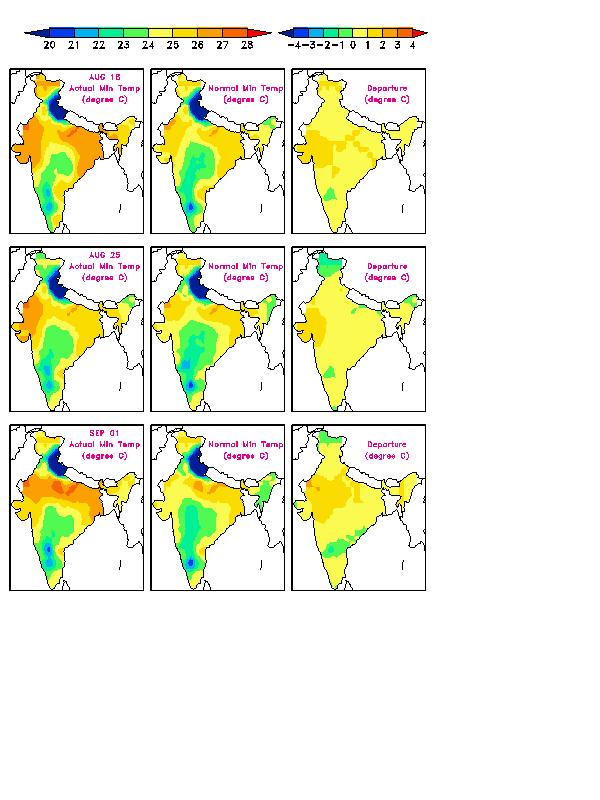
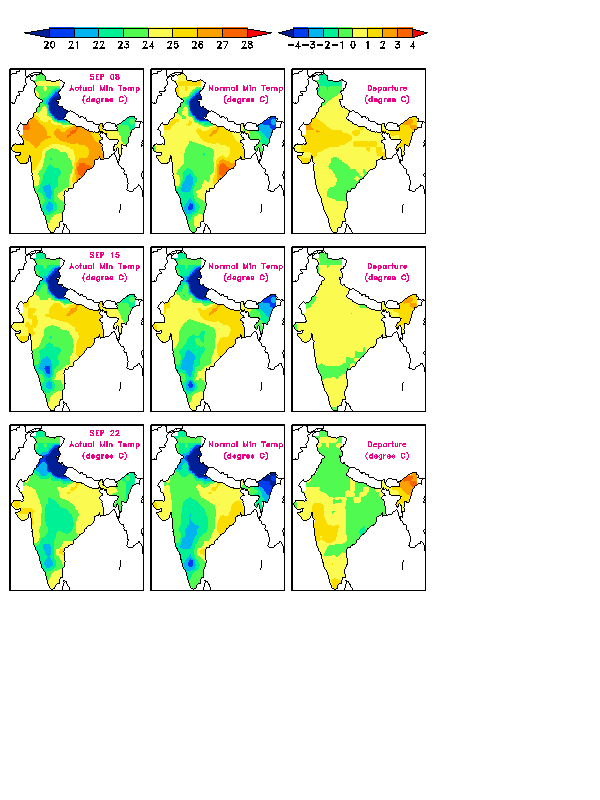
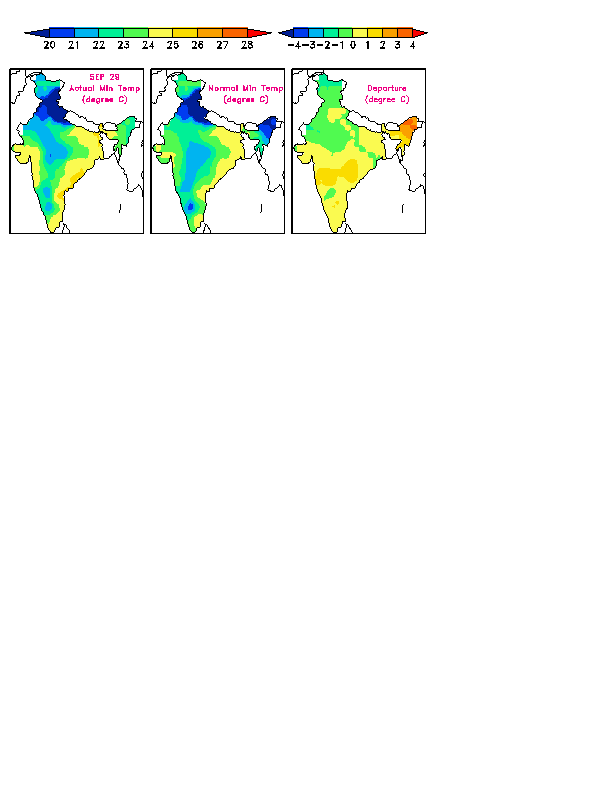
These charts are based on the weekly mean minimum temperatuare anomalies (departures from the long-term mean for the corresponding week) for 36 meteorological subdivisions of India, computed from real-time reports and published in the Weekly Weather Reports issued by the India Meteorological Department. Each row of the panels corresponds to the week ending the date indicated. In each row, the three panels indicate, from left to right, the mean minimum temperature in the week, the corresponding normal for the week and the departure.
Minimum Temperature for the May 20-26, May 27-June 02, June 03-09,


Minimum Temperature for the June 10-16, June 17-23, June 24-30
Minimum Temperature for the July 01-07, July 08-14, July 15-21
Minimum Temperature for the July 22-28,
July 29-August 04, August 05-11
Minimum Temperature for the August 12-18, August 19-25,
August 26-Sept 01
Minimum Temperature for the Sept 02-08, Sept 09-15, Sept
16-22
Minimum Temperature for the Sept 23-29
Monsoon On Line :
Last updated : Sept 29, 2010.