
भारतीय उष्णदेशीय मौसम विज्ञान संस्थान
Indian Institute of Tropical Meteorology
पृथ्वी विज्ञान मंत्रालय, भारत सरकार का एक स्वायत्त संस्थान
An Autonomous Institute of the Ministry of Earth Sciences, Govt. of India

Monsoon Mission Project Highlights
Prediction of seasonal summer monsoon rainfall over homogenous regions of India using dynamical prediction system
Seasonal prediction of Indian summer monsoon rainfall is a challenging task for the modeling community and predicting seasonal mean rainfall at smaller regional scale is much more difficult than predicting all India averaged seasonal mean rainfall. The regional scale prediction of summer monsoon mean rainfall at longer lead time (e.g., predicting 3–4 months in advance) can play a vital role in planning of hydrological and agriculture aspects of the society. Previous attempts for predicting seasonal mean rainfall at regional level (over 5 Homogeneous regions) have resulted with limited success (anomaly correlation coefficient is low, ACC 0.1–0.4, even at a short lead time of one month). The high resolution Climate Forecast System, version 2 (CFSv2) model, with spectral resolution of T382 ( 38 km), can predict the Indian summer monsoon rainfall (ISMR) at lead time of 3–4 months, with a reasonably good prediction skill (ACC 0.55). In the present study, we have investigated whether the seasonal mean rainfall over different homogenous regions is predictable using the same model, at 3–4 months lead time? Out of five homogeneous regions of India three regions have shown moderate prediction skill, even at 3 months lead time. Compared to lower resolution model, high resolution model has good skill for all the regions except south peninsular India. High resolution model is able to capture the extreme events and also the teleconnections associated with large scale features at four months lead time and hence shows better skill (ACC 0.45) in predicting the seasonal mean rainfall over homogeneous regions. [Dandi A. Ramu, Suryachadra A. Rao, Prasanth A. Pillai, M. Pradhan, G. George, D. Nagarguna Rao, S. Mahapatra, D.S. Pai, M. Rajeevan, Prediction of seasonal summer monsoon rainfall over homogenous regions of India using dynamical prediction system, Journal of Hydrology, 546, January 2017, 103–112]
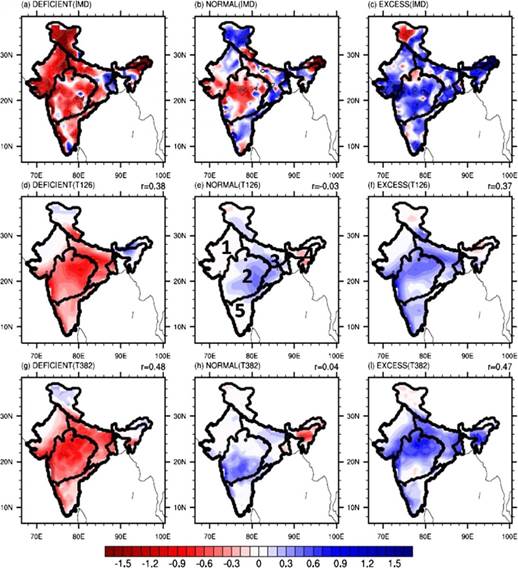
Fig 1: Seasonal rainfall anomaly composites for deficient, excess and normal years for observations (a–c), T126 (d–f) and T382 (g–i). Geographical locations of 5 homogeneous regions of India are marked in (e). Pattern correlation between model and observations is included in top of each model plots (d–i).
Why potential predictability and actual skill of ISMR is higher for Feb IC hindcasts in CFSv2-T382 ?: Role of initial SST error and teleconnectios
[ Reference :Pillai P.A., Rao S.A., Das R.S., Salunke K., Dhakate A. ‘Potential predictability and actual skill of Boreal Summer Tropical SST and Indian summer monsoon rainfall in CFSv2-T382: Role of initial SST and teleconnections’,Climate Dynamics, online, October 2017, DOI:10.1007/s00382-017-3936-y, 1-18. ]
Both actual and potential skills (calculated using relative entropy, RE) of CFSv2 hindcasts increase as lead time decreases for Niño3 index and equatorial East Indian Ocean (EEIO) SST anomaly and both the skills are close to each other for May IC hindcasts (zero month lead). At the same time the actual skill of ISMR and El Niño Modoki index (EMI) are close to potential skill for Feb IC hindcasts. It is interesting to note that, both actual and potential skills are nearly equal, when RE has maximum contribution to individual year’s prediction skill and its relationship with absolute error is insignificant or out of phase. In CFSv2 hindcasts, the major contribution to potential predictability is from ensemble mean and the role of ensemble spread is limited in CFSv2. The study address the reason for higher actual skill of ISMR in Feb IC, eventhoguh the SST boundary forcing have better skill for May IC hindcasts. For Feb IC hindcasts, initial month SST (Feb SST) has important predictive component for El Niño Modoki and ISMR leading to higher value of actual skill which is close to potential skill. Thus even though the simultaneous relationship between ensemble mean ISMR and global SST is similar for all ICs, the predictive component from initial SST anomalies are captured well by Feb IC (3 month lead) hindcasts only. In Figure 2 below, Feb IC has same pattern for initial SST relationship in observations, RE and ensemble mean. Meanwhile in observations and RE, by May IC, the initial SST pattern is weak, while it is like a strong La Nina in ensemble mean. Lack of proper contribution from initial SST and teleconnections induces large absolute error for ISMR in May IC hindcasts resulting in very low actual skill while the error is minimum and has maximum skill for Feb IC. Thus the use of potential predictability skill and actual skill collectively help to understand the fidelity of the model for further improvement by differentiating the role of initial SST and simultaneous boundary forcing to some extent.
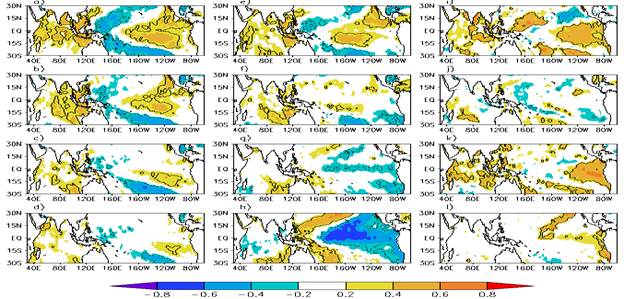
Figure 2:Correlation between observed ISMR and observed initial SST anomalies for a Feb, b March, c April and d May initial months. e–h are same as a–d, but the ISMR is prepared from CFSv2 T382 hindcasts initialized from February to May initial conditions respectively. i–l are same as e–h, but corresponding RE values are used instead of ISMR from CFSv2 hindcasts. All the values above 90% significant levels are represented in contours
Simulation of extreme Indian summer monsoon years in Coupled Model Intercomparison Project Phase 5 models: Role of cloud processes [ref. : Chaudhari H.S., Hazra A., Pokhrel S., Saha Subodh Kumar, Taluri S.S., Int. J. Climatol, DOI:10.1002/joc.5851]
The correct representation of cloud condensate vertical profile and stratiform/convective rain are crucial for the better simulation of excess and deficient monsoon, which may further improve the variability of Indian summer monsoon in coupled climate model. Further the study connotes the urgent need of the improvement of cloud parameterization in coupled climate models for the betterment of monsoon variability and realistic representation of deficient/excess monsoon rainfall patterns over Indian subcontinent.
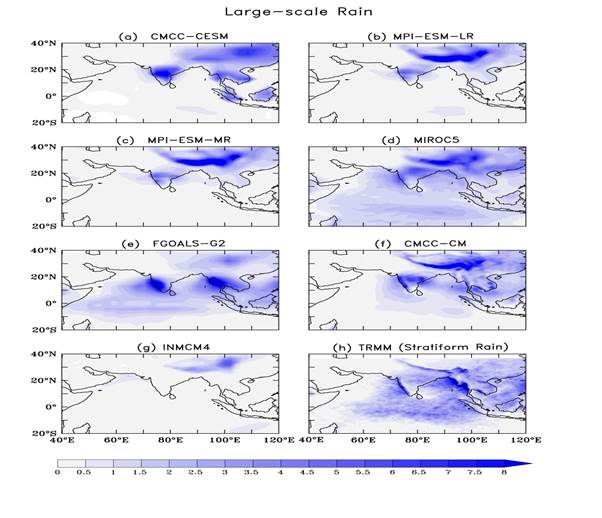
Figure. Large scale JJAS rainfall pattern simualted by different CMIP5 models.